
This fall, many high school juniors––and even some sophomores––will take the PSAT. In all likelihood, this will be their first experience with standardized college...
“Ever thought about taking the ACT?”
“Yeah, I've thought about it...the questions are supposed to be more straightforward than the ones on the SAT.”
“Then why not give it a shot?”
“It has that Science Section! There's no way I can get through that!”
The ACT Science Section is perhaps the most misunderstood section on any of the main college entrance exams, and it's intimidating enough to scare many students away from taking an otherwise very manageable test. But it doesn't need to be.
Perhaps the most insidious aspect of the ACT Science Section is actually something very simple: its name. In fact, the Science Section is barely about science at all, but about data: charts, tables, graphs, and your ability to read them. In much the same way as a reading comprehension question or a long word problem in math, the Science Section tests your ability to extract signals through noise. Can you quickly find your way through a mess of information—information that you may or may not need—to find the pieces of data that give you the right answer?
From CollegeVine:
The Science section of the ACT consists of 40 multiple-choice questions that you’ll answer over the course of 35 minutes. Just like the other sections of the ACT, the score that you receive on the Science section of the ACT will be a scaled score ranging from 1-36. This number is scaled from your raw score, which is the number of questions that you got correct on the Science section and each section of the exam is weighted equally.
Let's look at a sample ACT passage:
See how “noisy” that passage is? Charts, graphs, tables—all thrown at you at once, and it's almost a guarantee that you've never encountered this science before. To make matters worse, there are unfamiliar terms, acronyms, all sorts of chaos that you need to filter out in order to make sense of the passage.
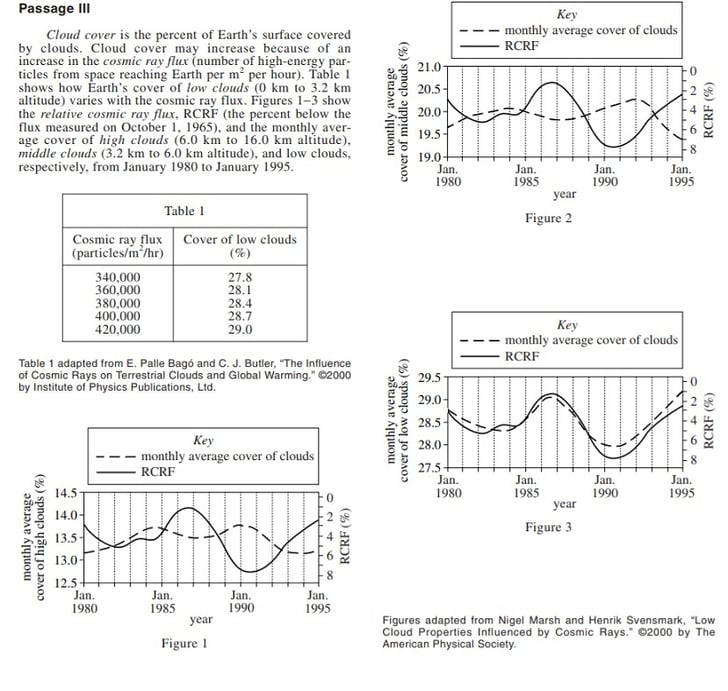
So how do you do that? First, you don't really need to “read” the passage straight through at all! (For more info on how to manage your time on test day, see this post on Albert). The trick is to do a quick survey, to identify what may be important. Look for terms that may be important, so that you can find them later. For example, RCRF seems important. So does cosmic ray flux. Look at differences in the tables and figures—low clouds, middle clouds, high clouds. Timelines occur on the X-axes of the 3 figures. Also see if you can spot trends or patterns. For example, in Table 1, both flux in the first column and Low Cloud Cover in the second column show a simple upward trend. None of the trends on the Science section will be complicated, but it's important to be able to spot them.
Now that we've found some important signals buried in all the noise of the passage, let's try a question or two. Look at Question 15 first (this is a mid-level question—questions in each passage tend to get a bit more difficult as you move on, but not too much!)

Here we have a couple of “signals”: low and high clouds and relative cosmic ray flux (RCRF). So we need to zoom into figures and tables that address this information. We also need to find a graph that pretty clearly shows direct correlation. With just a glance, we can see that Figure 3 shows a strong correlation between cloud cover and RCRF—the graphs are almost exactly the same! And what kind of clouds are shown on that graph? Low ones. The graph for high clouds in Figure 1 doesn't show a clear correlation at all. So we know that the statement is consistent with Figure 1 and 3. Answers A and B both assert that the statement is correct—but only A correctly states why: because the graphs for low clouds and RCRF are almost exactly the same.
Let's try a slightly harder question. Question 17 is the last question for the passage, and the ACT Science Section sometimes asks you to use a tiny bit of basic scientific intuition for these questions. Again, you want to use High and Low clouds as signals. But now it's introducing some new information—some clouds are made up of ice crystals, and some of water droplets. But there's nothing about water and ice in the passage! No worries—all you need to know is the simple scientific concept that water freezes and turns to ice as the temperature gets colder—basic stuff! So if high clouds are made up of ice, and low clouds are made up of water, clearly the higher clouds are colder. So that rules out A and B. To choose between C and D, look at the altitudes—C asks us about the 3.2-6.0 km range (middle clouds), while D asks about the 6.0-16.0 km range (high clouds). Since only D pertains to high clouds, D is the correct answer.
See how easy it is? Signals through noise. Once you practice a few of these, it becomes much easier to see how to navigate your way through the ACT Science Section. And ultimately, although this isn't really a science test at all, the skills you acquire from mastering this test will be extremely helpful in college and beyond—whether you're taking science classes, or doing anything else that involves sifting through large amounts of data to find the information that really matters.
About the Author
Steve Markofsky is one of our most experienced and qualified test prep tutors. For more information on ACT/SAT tutoring and to see profiles of tutors like Steve, click here.